










Data Dashboards & Business Intelligence
One decision layer across scattered business data
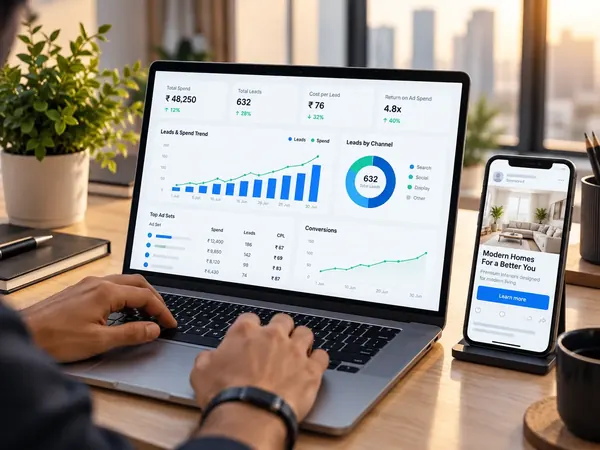
Data integration, metric design, dashboards and AI-assisted reporting for marketing, sales, commerce and operations.
Why Data Dashboards & Business Intelligence matters for your business.
Customers compare businesses online before they decide. Data Dashboards & Business Intelligence done well makes it easy for them to find you, trust you and get in touch.
Signs you need Data Dashboards & Business Intelligence
- 01
Customers find competitors before they find you
- 02
Enquiries are fewer than you expect
- 03
Work gets done ad hoc, without a plan
- 04
You can't see what is working
Without it
- Opportunities go to competitors
- Time and money spent without clear results
- No plan for what comes next
With Web o Adz
- A clear plan built around your goals
- Work done by one team, start to finish
- Simple monthly reporting
- Support whenever you need it
One team, a clear plan and work you can measure.
What We Deliver With Data Dashboards & Business Intelligence
Outcome-led scope
Work is tied to a defined business outcome and success measure.
Visible workflow
Owners, approvals and next steps stay clear throughout delivery.
Measured handover
You receive the assets, documentation and operating view needed to continue.
Everything That's Included
No hidden extras. No upsells. This is exactly what you get.
Our Step-by-Step Process
A proven, transparent approach that delivers consistent results every time.
Discover
Confirm goals, users, constraints, current systems and the success measure.
Blueprint
Define scope, responsibilities, milestones, approvals and the delivery approach.
Build and review
Produce in visible cycles, validate the work and resolve exceptions early.
Launch and improve
Release, document, train the team and monitor the first operating period.
Frequently Asked Questions
Still Have Questions?
Message us on WhatsApp and a real person from our team replies, usually the same day.
Chat With UsReady to Get Started?
Tell us about your business. We reply on WhatsApp the same day with a clear plan and a custom quote.